Make your data work for you!

We use technology and metrics to help businesses make informed decisions. Most of all, we are teachers. We support teams, small businesses, and individuals on their path to success. We flex with your business’ needs.

ic-customer-stories

Business Analytics and Data Visualization Available by User Role

Management

  • Pipeline report and dashboards
  • Marketing ROI
  • Software usage
  • Sales team activities
  • Customer service team activities
  • Sales, marketing & customer service KPIs

Sales

  • Personal pipeline reports and dashboards
  • KPIs by role
  • Opportunity conversion tracking
  • Personal activities
  • Aging opportunities and leads

Marketing

  • Lead conversion
  • Revenue generated by campaign
  • Leads generated by campaign
  • Email metrics
  • Website traffic/performance
  • Customer engagement metrics
  • Survey results

Customer Service

  • Cases opened
  • Cases closed
  • Aging cases
  • Overall caseload by team member
  • Case sentiment
  • Project status

View Dashboards and Data Visualization Options

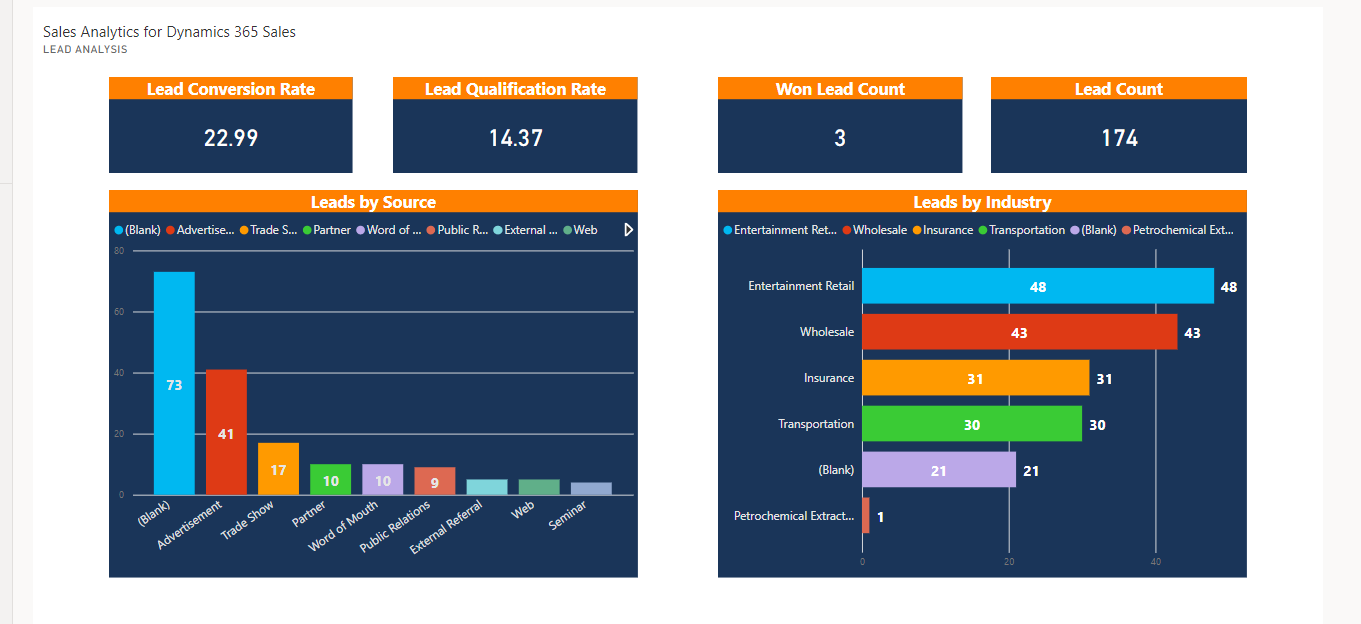
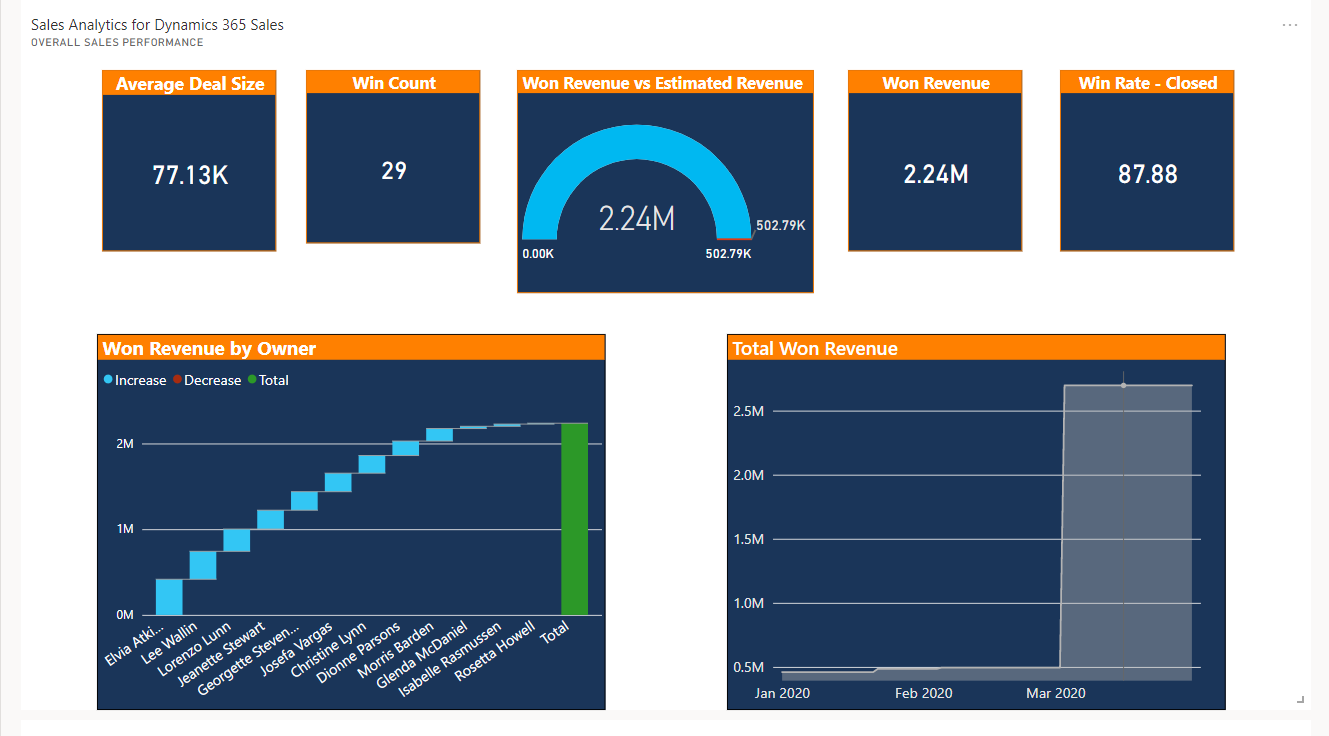
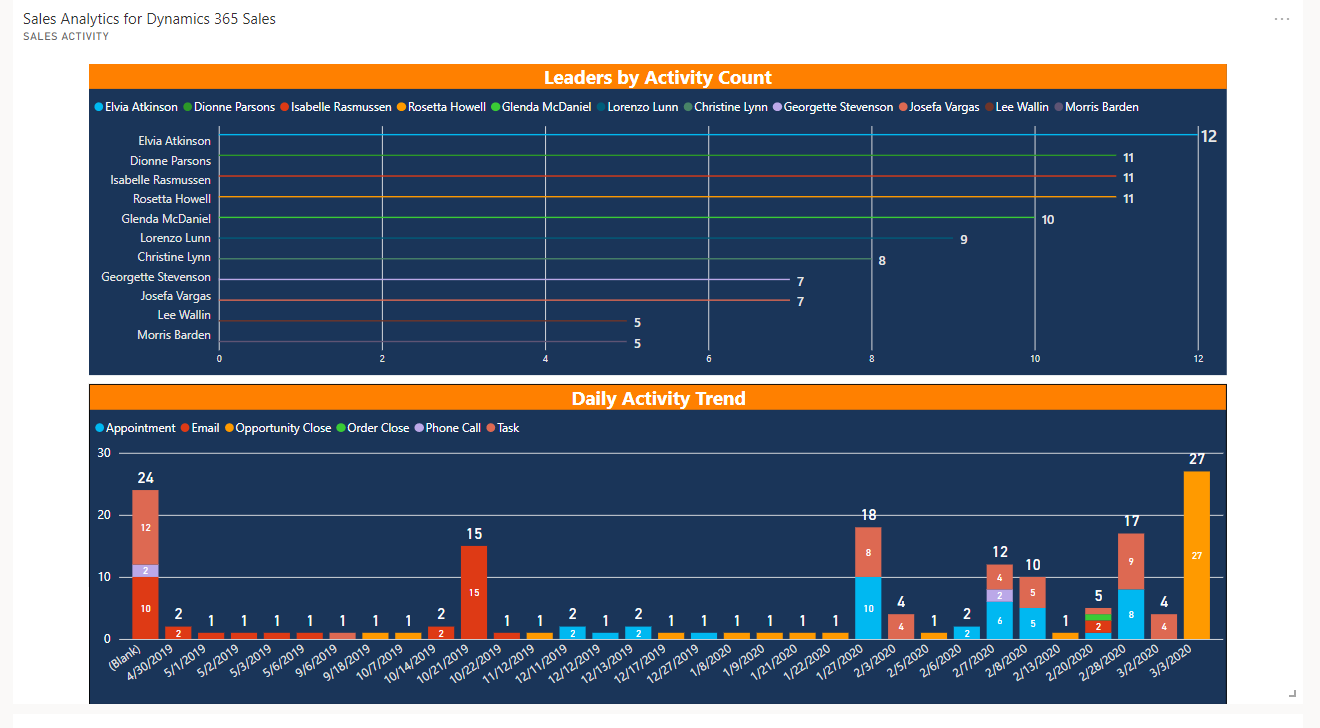
Some of the Dashboard, Reports & Data Visualization Tools We Support

img-partner-dynamics-365

Microsoft Dynamics 365

zoho-business-analytics

Zoho CRM

img-partner-salesforce

Salesforce

img-partner-act

Act!

img-partner-microsoft-power-bi

Microsoft PowerBI

img-partner-sql-server

Microsoft SQL Server Reporting Services

img-partner-google-analytics

Google Analytics

img-partner-google-sc

Google Search Console

img-partner-semrush

SEMRUSH

" We’ve been very happy with TopLine. They’ve treated us great; I think the product is better because they’re involved, so I would highly recommend working with them. "