
Introduction
Sales forecasting is a tool to predict performance. Various tables can show the metrics for individual salespeople, customers, and more. With all its capabilities, figuring out where to start can be hard.
Though forecasting can seem daunting, it offers incredible utility in measuring and predicting performance. Supervisors can use sales forecasts to measure their team's performance by looking at how much revenue they expect to bring in or have brought in over different periods. Supervisors can even incorporate quotas to assess if a sales team is meeting its goal and the types of revenue that are contributing to that goal.
In this article, we'll examine an example sales forecast to better understand how it works and how it can help your team.
Viewing a Forecast
Active forecasts can be viewed on the "Forecasts" page of the Sales Hub app in the performance section. Upon opening the "Forecasts" page, users will see a view like this:
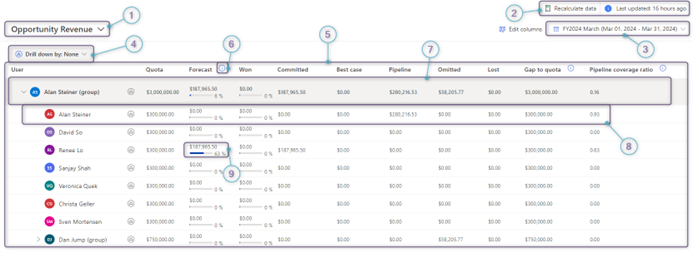
- Right above the forecast is the forecast name. Clicking the name allows users to switch which forecast they're viewing, similar to changing views or dashboards.
- The "Recalculate data" button lets users refresh the forecast using the most recent data. Users can see updates to the forecast to the right of this button.
- Below the "Recalculate data" button is the name of the forecast period, along with its start and end dates. Users can click on the name of the period to change the forecast period.
- Users can select "Drill down by: ___" to further break down the data and choose one of the preconfigured options.
- The forecast is in the main grid, and it displays the revenue each member of a sales team plans to generate based on the Opportunity's forecast category. Each row also has the salesperson's quota for that period, along with calculated fields showing how close each salesperson is to meeting that quota.
- The information icon next to some columns indicates they're calculated columns. Hovering over this icon displays the formula used to calculate the column's value:
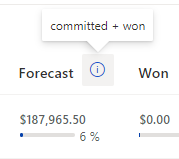
In this case, the "Forecast" column sums up the "Won" and "Committed" columns for each row.
7. The first row shows the team's overall data, including its quota and a breakdown of its combined revenue by forecast category.
8. This sales forecast has a row for each member of the team and the supervisor, which can be helpful when the supervisor is also generating sales.
9. Some columns have a percentage bar under their value, indicating how much revenue that column contributes to the quota.
Viewing Opportunities
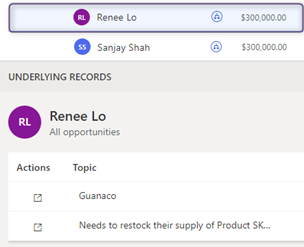
To see what opportunities a salesperson has closed or expects to close within a period, click on that user's name to bring up a list of the relevant opportunities:
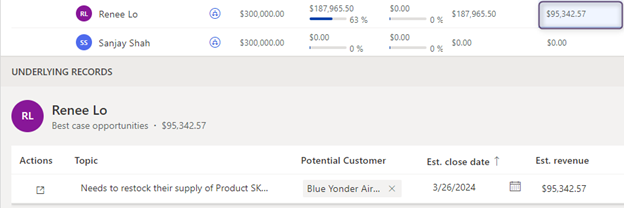
Click on a specific column to see just the opportunities that feed into that column:
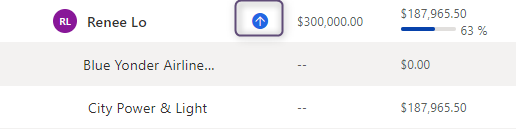
Users can also choose the drill-down icon on a specific row to toggle the drill-down rows if a drill-down option is selected. In this instance, users can see which accounts have opportunities Renee is pursuing during this period:
Conclusion
Sales forecasting is a powerful part of Dynamics 365, enabling supervisors and managers to predict performance in various ways. While an article can't cover all features of Dynamics sales forecasting, we can help you take advantage of this tool. If you're interested in learning more about how you can make the most of Dynamics 365 or other CRM products, reach out to TopLine Results at info@toplineresults.com or call us at 800-880-1960.
You must be logged in to post a comment.