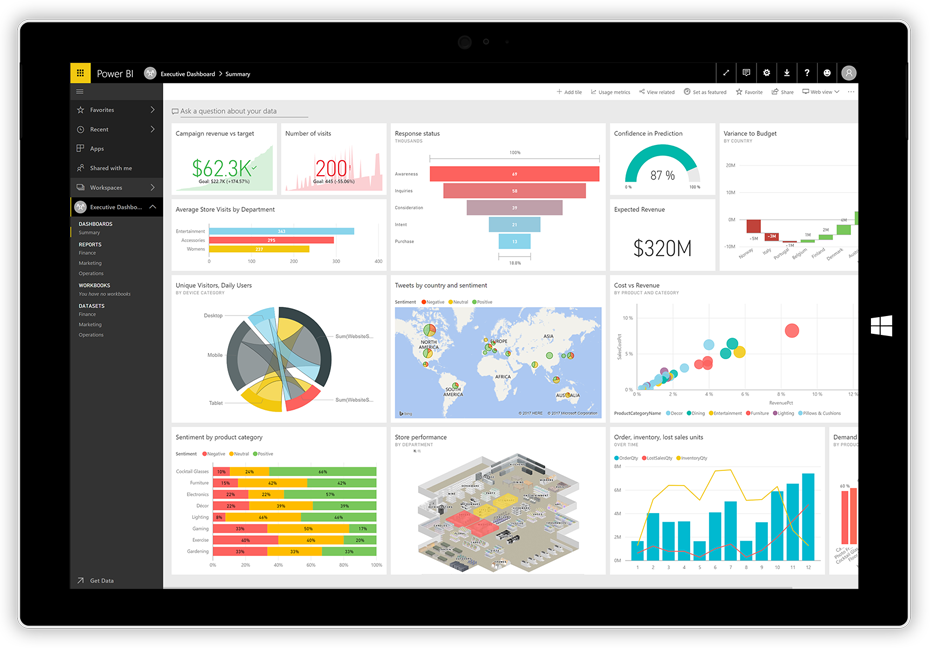
Business intelligence (BI) reporting tools refer to platforms that are designed to collect, analyze, transform, and report data from various sources. They present the data in a visual manner, often using interactive dashboards that provide actional insights.*
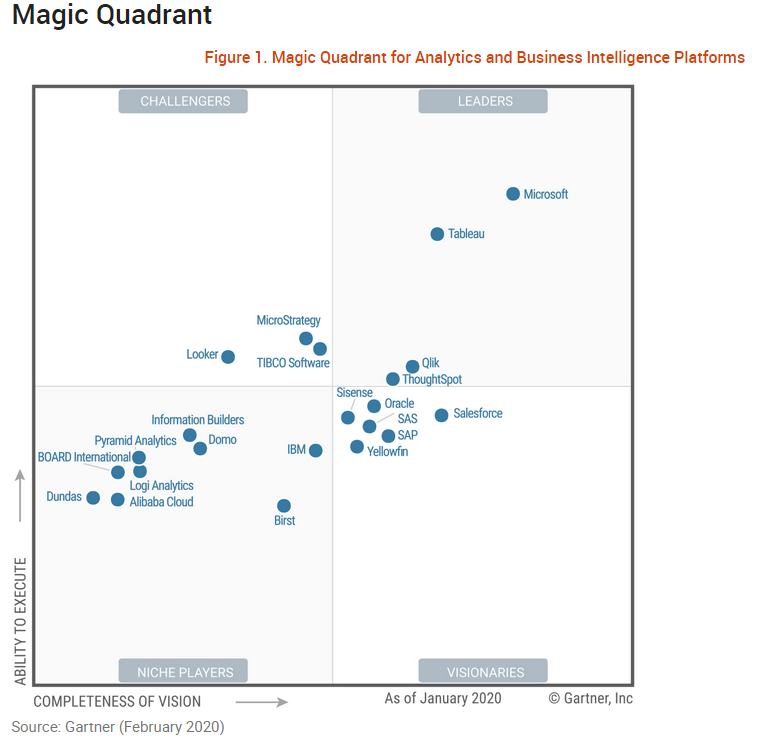
There are many tools available for business intelligence and analytics, but as you can see from the Gartner Magic Quadrant below, the leaders are Microsoft Power BI and Tableau (recently purchased by Salesforce).
To get the most out of any business intelligence platform, each of your key business application systems will need to be connected to the platform. For example, Power BI has a connector for Salesforce and, of course, Microsoft Dynamics CRM. You may also want to analyze other data sources, like your ERP and accounting data. QuickBooks Online and QuickBooks Desktop both have connectors to Power BI. Connectors may be built or can be purchased from a third party.
The crazy thing about Power BI is that the desktop version is free! However, you may want to upgrade to Power BI Pro to integrate with other tools like Dynamics 365.
The Analytics and Business Intelligence Leaders
Gartner indicates that by 2022 analytics technology will be ubiquitous, but only 10% of analysts will use its full potential.
Legacy technologies for business Intelligence include BusinessObjects from SAP and Cognos (pre-version 11) from IBM. These legacy tools were very expensive and complex to implement though they had powerful integrated support for the larger enterprise.

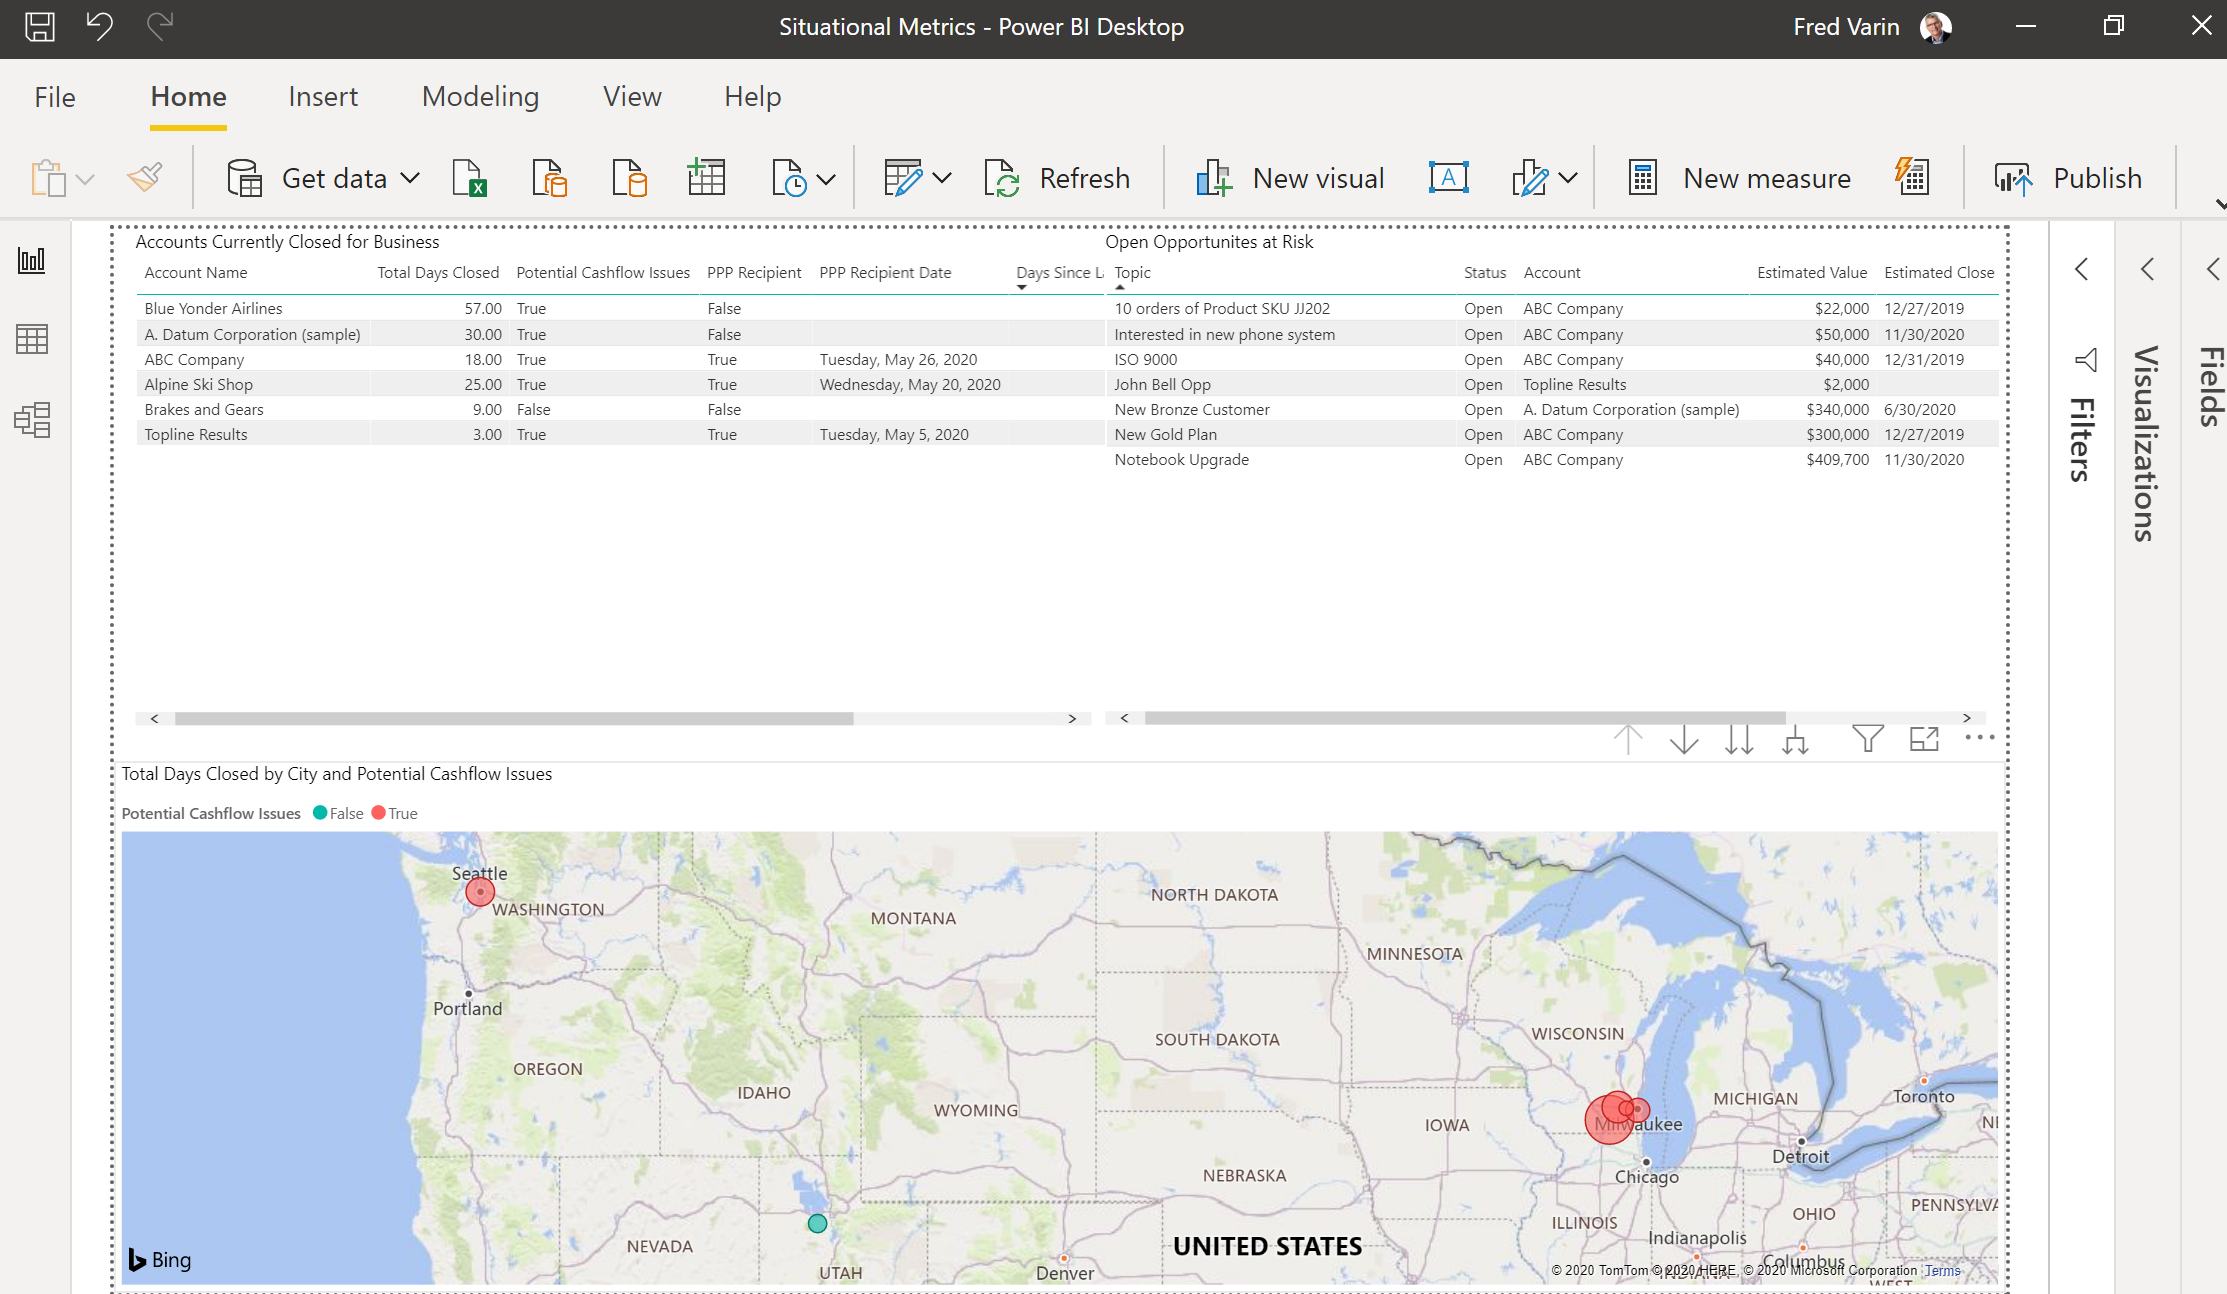
This sample visualization comes from Microsoft Power BI and reflects accounts currently closed due to Covid-19 and some of the associated opportunities at risk. The mapping shows the regional impact on the business.
Newer business intelligence tools are cloud-based and are more conducive for small and medium-sized businesses (SMBs) in that they are more agile, especially in their implementation and visualization capabilities. Eventually, they will lead to "augmented analytics" such as machine learning (ML) and artificial intelligence (AI) which are becoming competitive advantages.
Business Intelligence Definitions
To gain an understanding about these tools and how they can help SMBs, there are some fundamental definitions to know:
Data source connectivity: the ability to connect to various platforms both on-premise or in the cloud.
Data visualization: highly interactive dashboards with charts and maps.
Data storytelling: combining data visualization with a story that helps decision makers have a compelling understanding.
Embedded analytics: the integration of BI data visualization into a third-party application or portal (e.g., CRM or ERP)
Natural language query: enabling users to query data with business terms.
Security: the ability to enable a secure method of accessing data (authentication) so the data is protected and viewed by users who have the proper rights/permissions.
In the end, there are many choices to make when it comes to data analytics and visualization. Data is becoming a differentiating factor in how we compete today and in the future. Therefore, it is important to choose the right BI platform. Microsoft Power BI is a choice you can make with great confidence. It is powerful because of its ease of implementation, low cost, data visualization, and data connectivity.
TopLine Results has done many implementations of Power BI providing meaningful information to help clients make data-driven decisions. Please contact us at info@toplineresults.com or 800-880-1960 to request an introduction and discuss how we can help address your particular situation.
*Modified definition borrowed from datapine GmbH.


You must be logged in to post a comment.