Dynamics allows for several ways to analyze data, including creating charts and using custom views. These tools benefit from always having access to the latest CRM data. However, at times, a chart or view may not be able to pull the exact dataset you are looking for or may not support your desired format. These reports often need to be re-created and/or reformatted after CRM updates to provide the most accurate information. In these situations, many users have more experience with Microsoft Excel and prefer to use it to review and analyze data from CRM. This makes connecting an Excel sheet to Dynamics 365 Dataverse Environment an effective solution.
Microsoft Excel's "Data Connection" feature enables users to establish a direct connection between an Excel template and the Dynamics 365/Dataverse environment. This connection allows for data retrieval from Dynamics 365/Dataverse with input directly into Excel. In Excel, users have the option of dynamic formatting, which means they can see exactly what they need, formatted precisely how they want. This process saves time as it does not require new Excel sheets to be pulled whenever data is updated. It also reduces or eliminates the need for reformatting those reports each time they are pulled.
Let’s look at creating an Excel template that can connect to a Dynamics 365/Dataverse environment, pull a dataset and format it, and then refresh this data from the latest CRM data without making any other alterations.
Steps
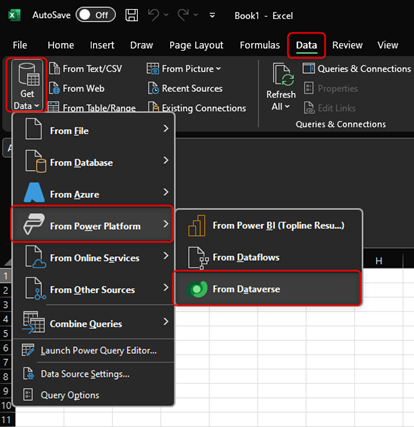
- Open a new Excel sheet, select the “Data” tab in the ribbon, and select “Get Data > From Power Platform > From Dataverse”.

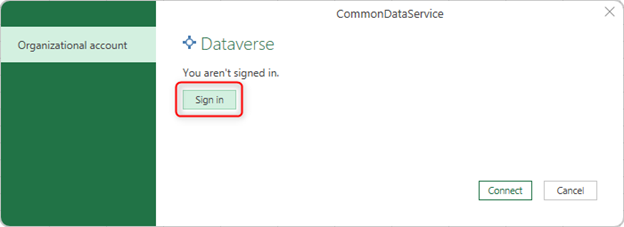
- If you have not logged in, you may see a prompt to sign into your Dynamics 365/Dataverse account. If so, click “Sign In” and provide the login, then select the “Connect” button.
 If your account is a member of multiple Dynamics 365/Dataverse environments, select the desired environment and choose the table you want to pull data from. Once selected, click the “Transform Data” button.
 If your account is a member of multiple Dynamics 365/Dataverse environments, select the desired environment and choose the table you want to pull data from. Once selected, click the “Transform Data” button.
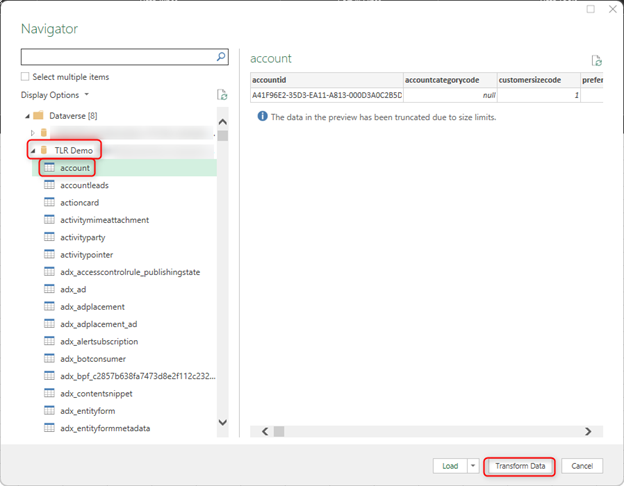
Transform the Data
The transform menu allows you to perform various actions on the data retrieved from Dynamics/Dataverse. These actions involve hiding/showing columns, moving and renaming items, and formatting the data in each column.
Selecting Columns
The "Choose Columns" tool enables you to select which columns/fields from the dataset you want in the output.
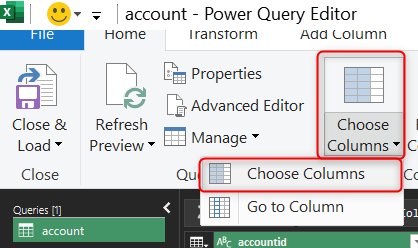
- In the ribbon under the “Home” tab, select the “Choose Columns > Choose Columns” option.
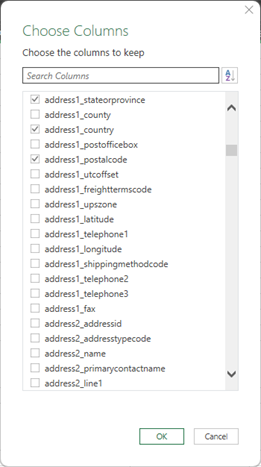
- In the “Choose Columns” menu, select the fields you want to show on your final data table. Note that the System name of the fields will show, which may be different than the field's display name. Once all desired fields are selected, click “OK”. This should then limit the visible columns to only those you chose.
Rename Columns
You can actively update the column headers to a more user-friendly value, as columns/fields show their database name. The “Rename” tool will allow you to rename any column as desired.
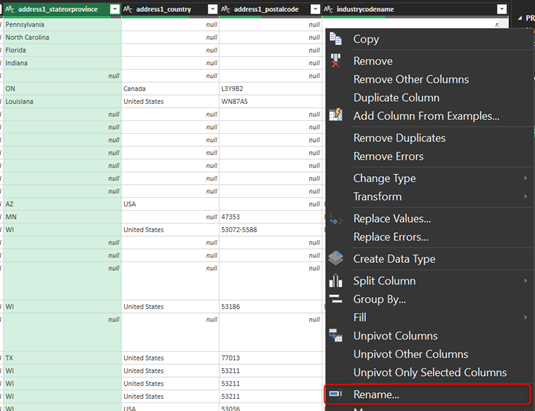
- Right-click on the column header for the column you want to rename and select the “Rename” option from the context menu.

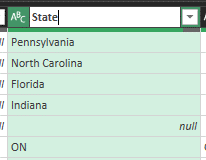
- Type in the new desired name and hit “Enter” to save the name update.

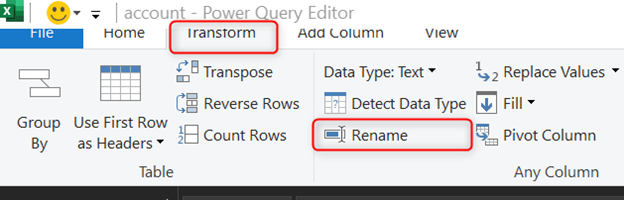
- Please note: You can also use the “Rename” action under the “Transform” tab to rename columns.

- Please note: You can also use the “Rename” action under the “Transform” tab to rename columns.
Reorder Columns
The “Reorder” tool allows you to select the order in which the columns/fields appear.
Click and drag the column header for the column you want to move and drag it to its desired location. The column header should remain in the new location.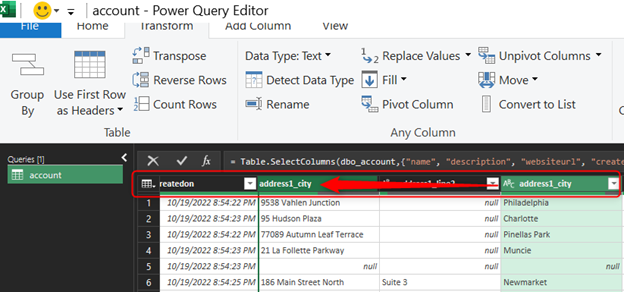
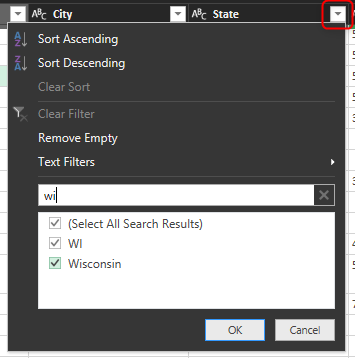
Filtering Data
If you desire only a subset of data, the dataset can be filtered to only show the selected rows in the final data table.
Identify the column you want to filter and select the desired filter criteria. Once applied, the dataset will remember the filter and will only output records that meet the specified filters.
Please Note: You can set additional filters on other columns/fields; however, records must meet the criteria of all filters to show in the resulting data set.
Finalizing the Dataset
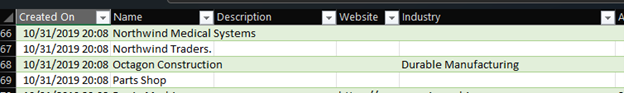
Once all the desired transformations are complete, select the “Close & Load” button, and the dataset will load into the Excel sheet.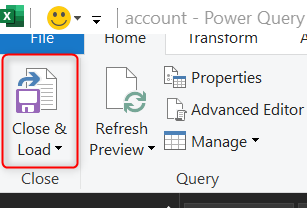
Updating Data
Since this data source is from Dynamics/Dataverse, you can update it easily by initiating a refresh action, which will update the table based on the latest data in Dynamics/Dataverse and make all the changes/updates defined in the “Transformation” menu.
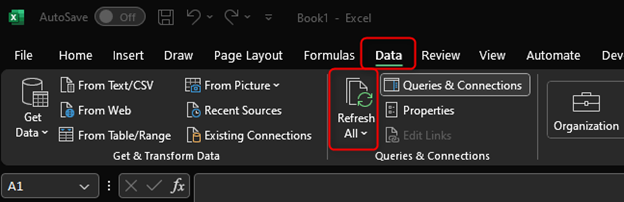
Select the “Data” tab, then select the “Refresh All” button. This will initiate a data update action, which, depending on the amount of data you are pulling from Dynamics/Dataverse, may take a few seconds to a few minutes.
The Power Platform data connection offers a great way to examine and analyze Dataverse data directly in the Excel interface. Connecting an Excel Sheet to Dynamics 365 Dataverse Environment ensures consistent updates and formatting, requiring minimal ongoing maintenance. It is a great choice for establishing reports that go beyond the capabilities of the default chart or view creator.
Here at TopLine Results, we help many customers set up Excel templates to pull the datasets they need, and we have several tools to help streamline this process and optimize the time required to add advanced filters and refresh data. If you would like assistance with setting up or improving connection-enabled Excel templates, please reach out to us at info@toplineresults.com or call us at 800-880-1960.
You must be logged in to post a comment.