Organizations running Dynamics 365 Customer Engagement (D365 CE) often ask a simple question with a complicated answer: “How do I build a report?”
Dynamics 365 Customer Engagement provides several reporting tools - each powerful, each useful, and each right for different scenarios. Choosing the correct option can make the difference between fast insights and painful workarounds.
In this article, we’ll compare the four major reporting approaches:
-
-
- Built-in views, charts, and dashboards
- SQL Server Reporting Services (SSRS) Reports
- Excel with Power Query (with dynamic refresh)
- Power BI
-
Let’s walk through pros, cons, real-world use cases, ease of use, and what uniquely sets each option apart.
Built-in Views, Charts, and Dashboards
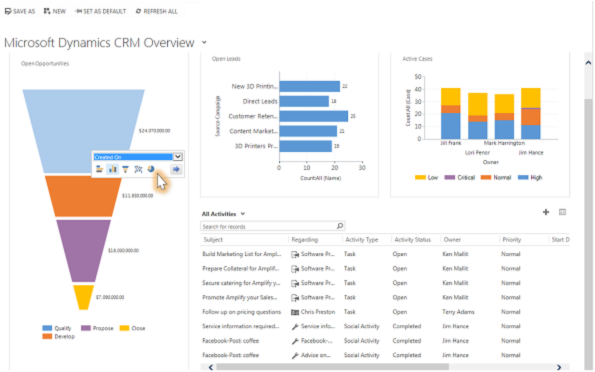
D365 CE includes native options such as:
-
-
- System and personal views
-
-
-
- Charts (bar, column, pie, funnel, etc.)
-
-
-
- Dashboards (multi-visual containers)
-
These features require no additional tools.
Pros
-
-
- Easy for end users - no coding or external tools needed
-
-
-
- Real-time data - views and charts always reflect the latest CRM record values
-
-
-
- Security built-in - users only see records they have permission to view
-
-
-
- Interactive filtering - views can include quick find, column sorting, and filtering
-
-
-
- Great for operational visibility - “What do I need to work on right now?”
-
Cons
-
-
- Limited visualizations (especially compared to Power BI)
-
-
-
- No complex data modeling - views can only report on related tables, not multi-hop or many-to-many aggregations
-
-
-
- Not suitable for large datasets – limited to 5,000 records
-
-
-
- No scheduled distribution or subscriptions
-
Here are some real-world examples
Good fit:
-
-
- A sales manager wants a dashboard of open opportunities grouped by owner.
-
-
-
- A customer service rep wants a view of active cases filtered by priority.
-
-
-
- A marketing coordinator wants to track leads created today.
-
Avoid when:
-
-
- You need cross-entity calculations (e.g., revenue trends compared with case volume).
-
-
-
- You have a large dataset - over ~5k records in a view.
-
-
-
- You need formatted reports (tables, multiple pages, logos).
-
Ease of use:
⭐⭐⭐⭐☆ (Very easy)
Most users can build views and charts with minimal training.
SQL Server Reporting Services (SSRS) Reports
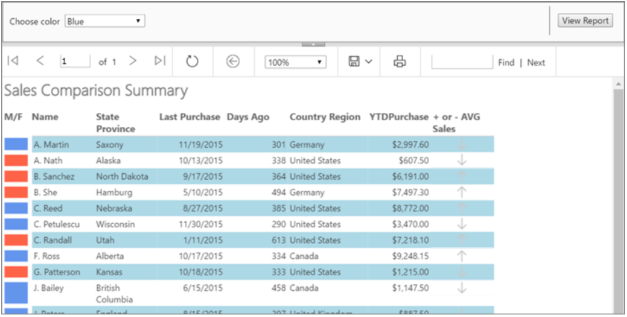
SSRS has long been the “classic” enterprise reporting option for Dynamics.
In D365 CE Online, SSRS still works, but with FetchXML-based data queries instead of direct SQL access.
Pros
-
-
- Highly formatted, pixel-perfect reports - invoices, statements, certification documents
-
-
-
- Support for parameters and drill-down
-
-
-
- Export to PDF, Word, Excel
-
-
-
- Repeatable layout - tables, grouping, headers/footers
-
-
-
- Best for compliance-heavy reporting
-
Cons
-
-
- No direct SQL access in D365 online - must use FetchXML
-
-
-
- Steep learning curve - requires Report Builder or Visual Studio
-
-
-
- Not self-service - usually needs a developer
-
-
-
- Performance limitations - complex FetchXML queries may hit timeouts
-
-
-
- No real-time slicing and analysis - you get a snapshot
-
Real-world examples
Good fit:
-
-
- Generating customer invoices directly from CRM data
-
-
-
- Regulatory reports requiring precise formatting
-
-
-
- Operational reports that must be printed or exported with the same structure every time
-
Avoid when:
-
-
- You want ad hoc analysis or dashboards
-
-
-
- You need cross-database data sources
-
Ease of use:
⭐☆☆☆☆ (Advanced)
Requires technical knowledge of FetchXML, datasets, and layout design.
What sets SSRS apart:
-
-
- It's the only option with full page-level formatting.
-
-
-
- It’s the strongest option for formal, repeatable, document-style reports.
-
Excel with Power Query (Dynamic Refresh)
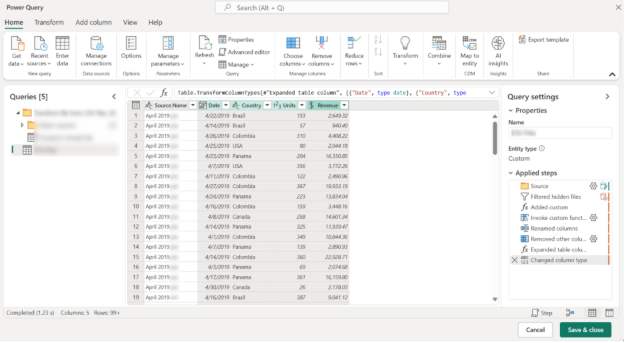
Excel remains one of the most popular reporting tools for business users.
With Power Query, you can:
-
-
- Connect to D365 CE via OData or Dataverse connector
-
-
-
- Build transformations
-
-
-
- Refresh data on demand or via scheduled refresh (if stored in OneDrive/SharePoint + Power BI service)
-
Pros
-
-
- Extremely familiar to most users
-
-
-
- Powerful data shaping using Power Query (merge, split, group, pivot)
-
-
-
- Offline analysis - data is stored in Excel
-
-
-
- Great for exporting and manipulating CRM data
-
Cons
-
-
- Not real-time - data must be refreshed
-
-
-
- Large refreshes can be slow
-
-
-
- File-based - version control becomes an issue
-
-
-
- Security depends on the authenticated user
-
Real-world examples
Good fit:
-
-
- A finance user exports opportunities monthly for forecasting
-
-
-
- A marketer analyzes leads with complex Excel formulas
-
-
-
- A sales manager wants offline pivot tables based on CRM data
-
Avoid when:
-
-
- You need visualizations beyond Excel charts
-
-
-
- You want strict, centralized data governance
-
Ease of use:
⭐⭐⭐⭐☆ (Easy–Moderate)
Basic use is very easy; Power Query transformations require some training.
What sets Excel apart:
-
-
- Best ad-hoc analysis option
-
-
-
- Perfect for users who “live in Excel”
-
-
-
- Great for offline work
-
Power BI
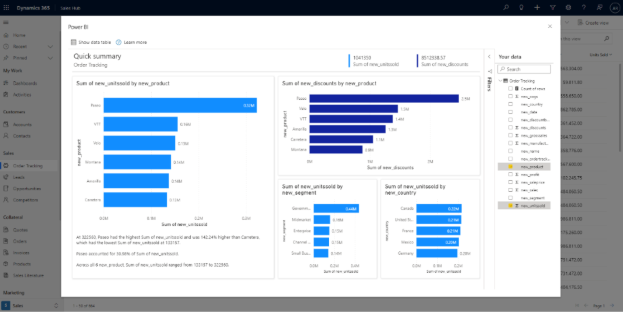
Power BI is now the most flexible and strategic analytics platform for D365 CE.
It supports:
-
-
- Dataverse connector
-
-
-
- DirectQuery (Premium)
-
-
-
- Large data volumes
-
-
-
- Cross-entity modeling
-
-
-
- Rich dashboards and visualizations
-
Pros
-
-
- Advanced, interactive visualizations
-
-
-
- Cross-system data modeling - combine CRM + ERP + spreadsheets + external APIs
-
-
-
- Scheduled refresh
-
-
-
- Role-based security
-
-
-
- Drill-down, drill-through, filters, bookmarks
-
-
-
- Embeddable in D365 CE, Teams, SharePoint
-
Cons
-
-
- Not real-time unless using DirectQuery/Premium
-
-
-
- Some features require Power BI Pro or Premium
-
-
-
- Training needed - modeling and DAX can be challenging
-
-
-
- Not suitable for pixel-perfect financial or print layouts (SSRS is better)
-
Real-world examples
Good fit:
-
-
- Company-wide sales dashboards pulling opportunity data
-
-
-
- Customer service performance metrics (case resolution time, SLA trends)
-
-
-
- Marketing campaign ROI combining CRM + website + ad platform data
-
-
-
- Executive scorecards with KPIs
-
Avoid when:
-
-
- You need a printable, formal report
-
-
-
- You want simple, operational grids (native views are easier)
-
Ease of use:
⭐⭐⭐☆☆ (Medium)
Easy for basic dashboards; advanced modeling requires training.
What sets Power BI apart:
-
-
- Best for analytics at scale
-
-
-
- Best for cross-system reporting
-
-
-
- Best option for executive KPIs
-
-
-
- Unmatched visualization and interactive exploration
-
Comparison Summary
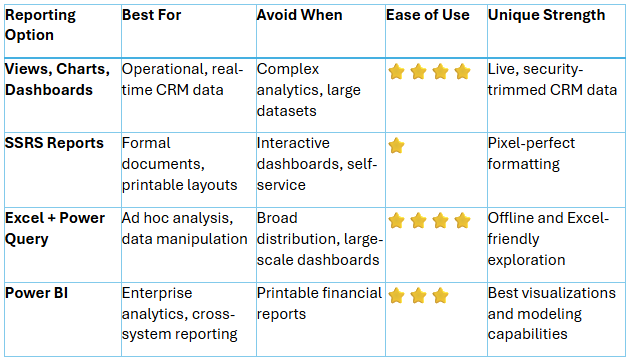
Final Thoughts: Choose the Right Tool for the Job
There is no single “best” reporting option in Dynamics 365 Customer Engagement - only the best option for your scenario.
-
-
- For daily operations, start with views and dashboards.
-
-
-
- For formal, repeatable documents, choose SSRS.
-
-
-
- For ad-hoc or Excel-heavy users, use Power Query.
-
-
-
- For enterprise analytics and executive insights, choose Power BI.
-
Using these tools together creates a complete reporting strategy that serves end users, analysts, managers, and executives across your organization.
Contact TopLine Results for assistance with your Dynamics 365 reporting needs. We’ll be happy to help you find and use the right tool for your specific business objectives. Email us today at info@toplineresults.com.
You must be logged in to post a comment.