The Dynamics 365 Opportunity Pipeline View is a powerful tool that enables sales teams to manage and track opportunities more effectively. This intuitive interface provides a comprehensive view of the sales pipeline, helping teams identify trends, monitor progress, and make data-driven decisions.
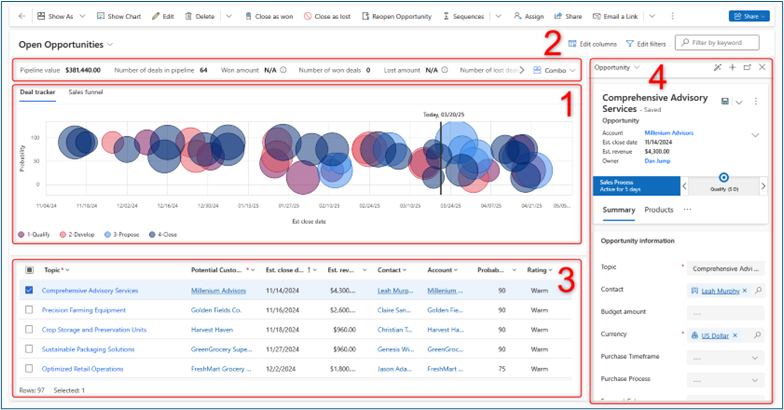
In this blog, we'll explore how to access this view and break down the four core components of the Pipeline View:
-
- Charts (Deal Tracker and Sales Funnel)
- Filterable Metrics
- Opportunity List View
- Record Side Panel
You can maximize your pipeline's value and drive better sales outcomes by understanding how each component functions.
Accessing the Pipeline View
The Pipeline View can be accessed from the Action Ribbon in the top left corner of the screen by clicking on the "Show As" dropdown and selecting "Pipeline View." Any existing system or personal views can be used with the Pipeline View without needing to be recreated, ensuring a seamless transition. This flexibility allows sales teams to leverage their familiarity with existing views while benefiting from the enhanced visual and functional aspects of the Pipeline View.
Important: The Pipeline View is available only within the default Opportunity entity and cannot be used with custom or standard entities such as Leads or Quotes.
Regarding licensing, the Pipeline View is available in the Sales Professional, Sales Enterprise, and Sales Premium licensing tiers, ensuring that sales teams of all sizes can take advantage of its powerful features.
1. Charts (Deal Tracker and Sales Funnel)
At the top left of the Pipeline View, you'll find two key chart options: the Deal Tracker and the Sales Funnel.
Deal Tracker
The Deal Tracker bubble chart visually represents the deals* in your selected view based on key factors like close date, probability, revenue, and pipeline phase.
-
- Bubbles are positioned horizontally based on their close dates: estimated close date for open opportunities and actual close date for closed opportunities.
- Bubbles are positioned vertically based on their probability.
- Bubble size is based on revenue: estimated revenue for open opportunities and actual revenue for closed opportunities.
- Each bubble is colored according to its current pipeline phase (as indicated by the legend in the bottom left corner of the chart).
- The legend can be used as a filter to show or hide deals with a specific pipeline phase.
- Hovering over any bubble pulls up a quick view card with insights into the deal it represents. Clicking a bubble opens the Record Side Panel for that opportunity.
* "Closed Lost" opportunities do not appear in the Deal Tracker.
Sales Funnel
The Sales Funnel provides a visual representation of your sales process, grouping deals by their current pipeline phase.
-
- Hovering over a pipeline phase displays a quick view card with aggregate data for that phase, including estimated revenue, total opportunity count, and percentage of total opportunities.
- Clicking a pipeline phase filters both the chart and the List View below to show only opportunities in that phase.
2. Filterable Metrics
Above the charts, Dynamics 365 displays customizable metrics that allow sales teams to analyze pipeline data more effectively.
By default, Dynamics provides:
-
- Pipeline value and Number of deals in pipeline (Open opportunities)
- Won amount and Number of won deals
- Lost amount and Number of lost deals
These metrics dynamically update based on your current view and any applied filters.
Customizing Metrics
To edit or create new metrics:
-
- Click the "List/Combo" dropdown to the right of the metrics bar.
- Select "Edit metrics" to view, edit, delete, or toggle the visibility of existing metrics.
- Reset metrics to default or create a custom metric as needed.
Filtering with Metrics
Clicking a metric applies a dynamic filter to the displayed opportunities. For example, clicking "Won amount" or "Number of deals in pipeline" in an All Opportunities view filters the charts and List View to show only open opportunities.
An active metric filter is indicated by a blue highlight, and clicking it again removes the filter.
Metrics provide instant insights into your current pipeline, helping teams make informed sales decisions.
3. Opportunity List View
Below the charts, the List View displays a detailed table of opportunities for the selected view.
This functions similarly to the standard Dynamics read-only list view, with one major difference:
The Topic hyperlink appears in a bolder, darker blue compared to the standard light blue in Dynamics.
Clicking this hyperlink opens the Record Side Panel instead of navigating to a new page.
Expanding and Hiding the List View
-
- Resize the List View by clicking and dragging the grey line between the Charts and List View sections.
- To hide the charts and focus only on the List View:
- Click the "Combo" dropdown in the metrics bar.
- Select "List."
-
- To bring back the charts, follow the previous steps, but select "Combo."
- The Metrics Bar and Record Side Panel remain visible regardless of the view mode.
4. Record Side Panel
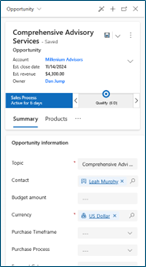
Selecting an opportunity from either the Charts or List View opens the Record Side Panel on the right side of the screen.
-
- This panel condenses the full record form into a single-column layout while still maintaining all functionalities, including:
- Full content visibility
- Action Ribbon access
- Ability to switch forms using the form selector in the top left corner
Additional Features
-
- Use the top ribbon to:
- Adjust the layout options for the side panel
- Add a new activity
- Open the full record on a new page
- Close the Record Side Panel
The Record Side Panel allows sales reps to review and update opportunity details efficiently—without leaving the Pipeline View. It also provides full access to related activities, notes, and communication history, making it easy to stay on top of deal progress and follow-ups.
The Dynamics 365 Opportunity Pipeline View is more than just a visual dashboard—it's a powerful tool for managing and enhancing sales. By combining interactive charts, real-time metrics, and quick-view insights, sales teams can identify opportunity trends, improve productivity, and close deals more efficiently.
Whether you're a sales rep looking to prioritize your pipeline or a manager seeking deeper insights into team performance, the Opportunity Pipeline View provides the tools you need to drive sales success.
Need Help Implementing the Opportunity Pipeline View?
The CRM experts at TopLine Results are available to help! Contact us here.


You must be logged in to post a comment.